Toolkit
Consulting
Contact
Free Trial
8 min
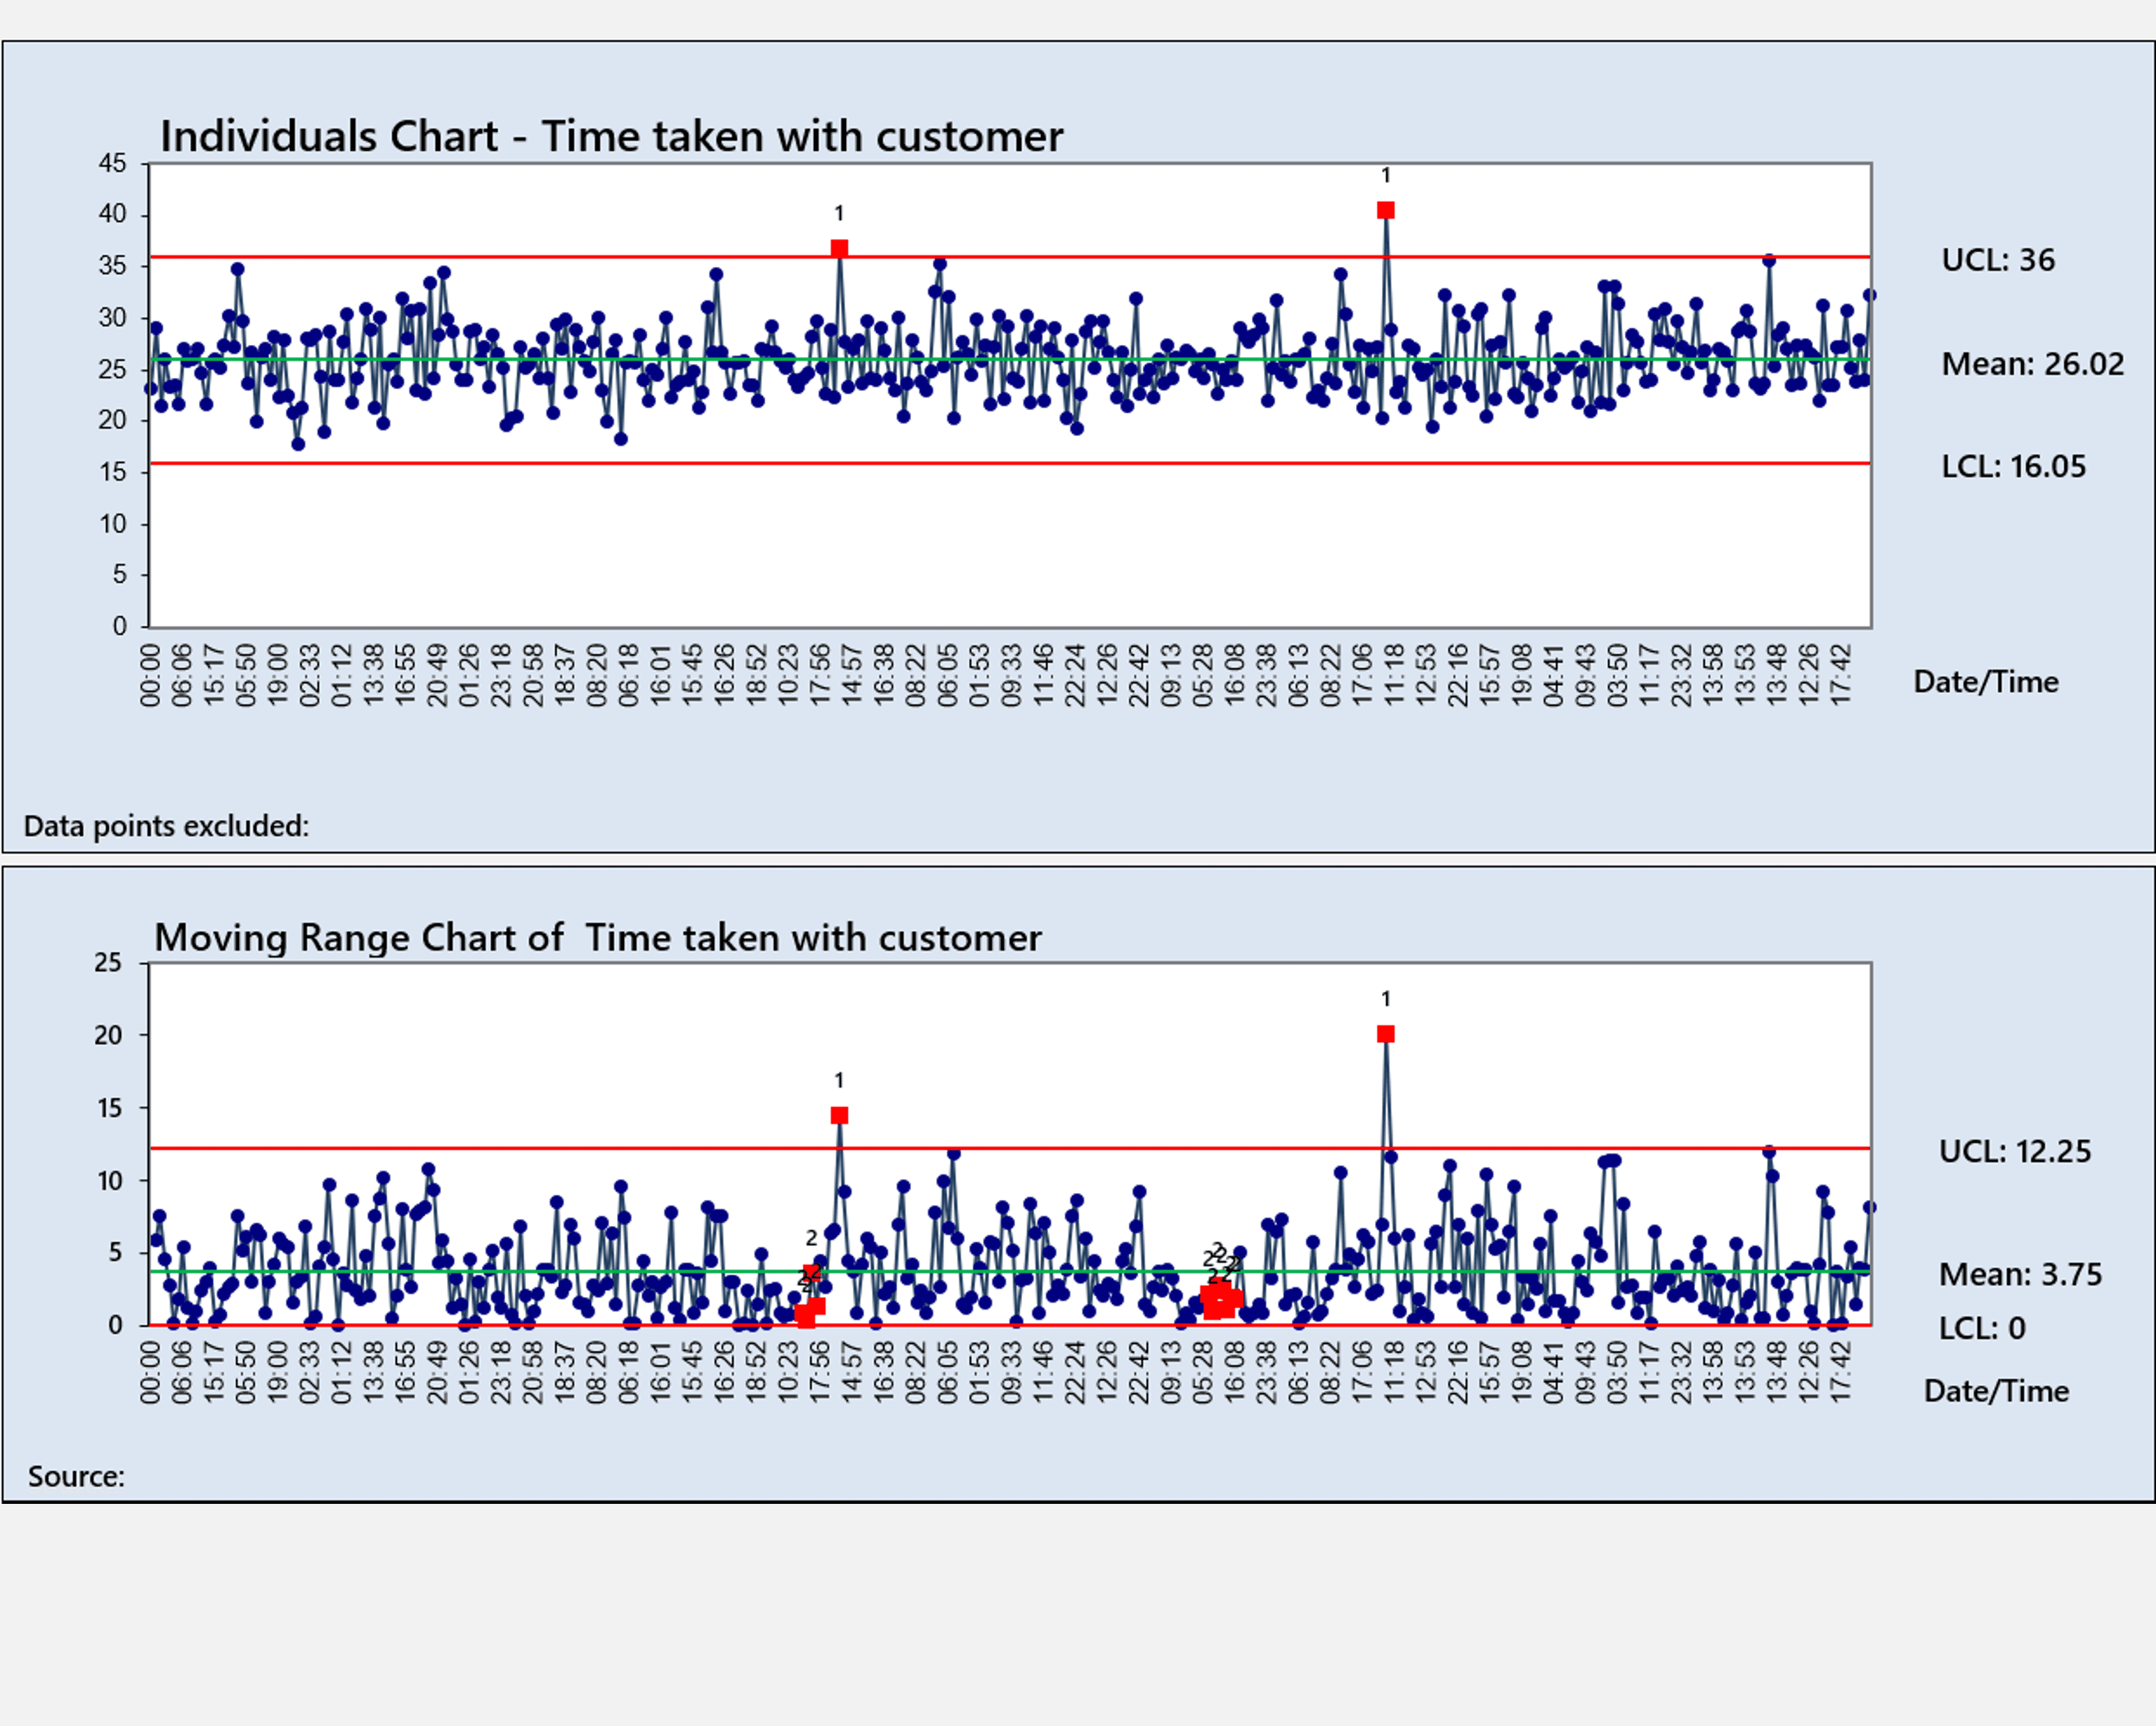
How to create Control Charts for both continuous and discrete data (IMR, Xbar-R, p, np, c, u)
‹ Introduction to the Data Analysis Toolkit
Histograms, Normality and Process Capability ›